
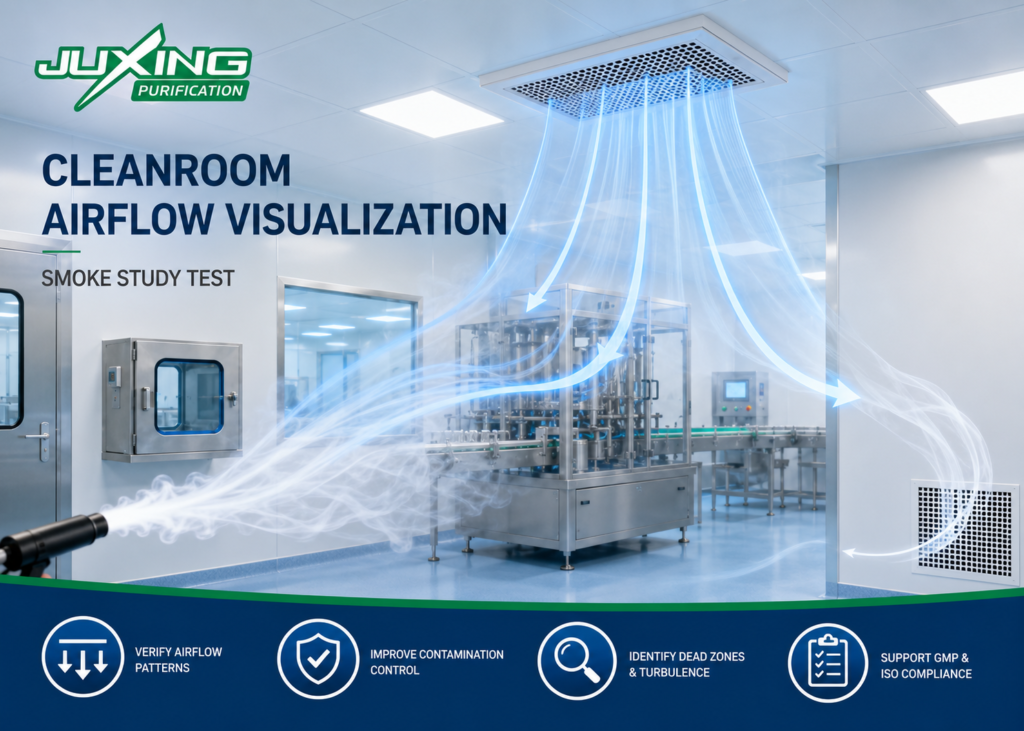
Cleanroom Airflow Visualization: Smoke Study Guide for Cleanrooms
Introduction
Cleanroom performance cannot be judged by particle count, air change rate, or differential pressure alone. Even if a cleanroom has sufficient HEPA-filtered airflow, contamination control may still fail if air moves in the wrong direction, creates turbulence, or forms stagnant zones around critical areas.
This is why cleanroom airflow visualization, often called a smoke study, is an important cleanroom qualification and troubleshooting method.
For pharmaceutical manufacturers, hospital cleanroom projects, electronics facilities, EPC contractors, and cleanroom consultants, airflow visualization helps confirm whether the installed HVAC system actually supports the intended contamination control strategy.
What Is Cleanroom Airflow Visualization?
Cleanroom airflow visualization is a test method used to make invisible air movement visible.
A visible smoke or fog medium is released into selected locations, and the airflow path is observed and recorded. The test helps show whether air moves smoothly from clean supply areas toward return or exhaust points, and whether the airflow protects critical zones.
In simple terms:
Airflow visualization shows where clean air goes, where contaminated air may travel, and whether airflow patterns support contamination control.Why Airflow Visualization Matters
Airflow visualization is important because calculated airflow does not always represent real airflow behavior after installation.
It helps identify:
- Turbulence near doors, equipment, or operators
- Dead zones with poor air movement
- Reverse airflow
- Airflow short-circuiting
- Poor return air locations
- Disruption around filling lines or workstations
- Weak protection of critical process areas
- Airflow disturbance caused by personnel movement
In GMP sterile manufacturing, EU GMP Annex 1 includes airflow visualization among cleanroom qualification considerations where relevant to the cleanroom design, together with airflow tests, pressure difference tests, recovery tests, and filter integrity tests.
Airflow Visualization vs Particle Testing
Particle testing measures airborne particle concentration.
Airflow visualization shows airflow behavior.
Both are important, but they answer different questions.
| Test Method | Main Purpose | What It Shows |
|---|---|---|
| Particle counting | Verifies cleanliness classification | Particle concentration level |
| Airflow measurement | Measures air volume or velocity | HVAC airflow quantity |
| Differential pressure test | Verifies pressure relationship | Airflow direction between rooms |
| Recovery test | Measures cleanup performance | How quickly particles are removed |
| Airflow visualization | Observes airflow pattern | Whether airflow protects critical areas |
A cleanroom may pass a particle count test under stable conditions but still have airflow weaknesses that appear during operation. This is why airflow visualization is especially valuable for critical applications.
When Is a Smoke Study Needed?
Airflow visualization may be used during:
- Cleanroom commissioning
- GMP qualification
- HVAC troubleshooting
- Layout modification
- Equipment installation
- Door or pass box position review
- Return air grille optimization
- Investigation of contamination events
- Verification of unidirectional airflow protection
For sterile pharmaceutical areas, FDA guidance emphasizes the importance of evaluating airflow patterns in aseptic processing environments, especially around critical areas and supporting clean areas.
Common Applications
Pharmaceutical Cleanrooms
Airflow visualization helps verify whether clean air protects product exposure points, filling areas, weighing rooms, sampling rooms, and compounding areas.
Hospital Operating Theaters
Smoke studies may help evaluate whether supply airflow, return air, doors, equipment, and personnel movement disturb the intended clean zone around the operating table.
Electronics and Semiconductor Cleanrooms
Airflow visualization helps identify turbulence, heat plume effects, and airflow obstruction around sensitive equipment.
Laboratories and Containment Rooms
For negative pressure rooms or hazardous areas, visualization helps confirm that air moves into the room and does not escape toward adjacent spaces.
How a Cleanroom Smoke Study Is Performed
A typical airflow visualization study includes the following steps.
1. Define the Test Objective
The team should confirm what needs to be verified:
- Critical zone protection
- Room airflow pattern
- Door opening effect
- Equipment airflow disturbance
- Return air path
- Operator movement impact
- Positive or negative pressure airflow direction
2. Select Test Locations
Test locations should be selected based on process risk, room layout, airflow design, and contamination control strategy.
Typical locations include:
- HEPA supply outlet area
- Critical work zone
- Product exposure point
- Door opening area
- Pass box or material transfer area
- Return air grille
- Corners and potential dead zones
- Around large equipment
3. Generate Visible Smoke or Fog
A suitable visualization medium is released carefully without disturbing the airflow pattern.
The medium should be appropriate for the facility and should not contaminate the environment, product, or equipment.
4. Observe and Record Airflow
The airflow pattern should be observed from multiple angles and recorded by video where required.
5. Evaluate the Results
The team reviews whether airflow behavior matches the design intent and whether any contamination risks are present.
6. Correct and Retest if Needed
If airflow problems are found, the design may require adjustment, such as changing return air positions, modifying supply airflow, improving equipment layout, or controlling door operation.
What Should Be Evaluated?
A professional airflow visualization study should evaluate more than whether “smoke moves.”
Important questions include:
- Does airflow move from cleaner areas toward less clean areas?
- Does air protect the critical zone?
- Are there turbulent areas around products or operators?
- Is there reverse flow near doors or pass boxes?
- Are return air grilles positioned effectively?
- Are there stagnant zones behind equipment?
- Does operator movement disturb airflow protection?
- Does door opening break the pressure cascade?
- Does airflow recover after a disturbance?
For GMP applications, the result should be linked to the facility’s contamination control strategy, not treated as a decorative video.
Good Airflow vs Poor Airflow
| Airflow Condition | Good Design Indicator | Risk Indicator |
|---|---|---|
| Supply air | Smooth and stable | Strong turbulence or unstable flow |
| Critical zone | Protected by clean airflow | Smoke enters product exposure area |
| Return air | Pulls air away effectively | Air stagnates before reaching return |
| Door area | Airflow direction remains controlled | Reverse flow or uncontrolled mixing |
| Equipment area | Air moves around equipment effectively | Dead zones behind machines |
| Operator movement | Limited disturbance | Strong airflow disruption |
Common Airflow Problems Found by Smoke Studies
1. Dead Zones
Air does not move effectively in certain corners or behind equipment.
2. Turbulence
Air swirls unpredictably, which may increase contamination risk.
3. Reverse Flow
Air moves opposite to the intended direction, especially near doors or transfer points.
4. Short-Circuiting
Clean supply air returns too quickly without sweeping the controlled area.
5. Equipment Obstruction
Large machines block airflow and create stagnant zones.
6. Poor Return Air Placement
Return air grilles may be too high, too low, blocked, or incorrectly positioned.
7. Operator-Induced Disturbance
Personnel movement can disturb unidirectional airflow in critical zones.
Relationship With ACH and Recovery Time
Air change rate and recovery time are closely related to airflow visualization, but they are not substitutes for it.
A cleanroom may have a high ACH but still perform poorly if supply air and return air are not well distributed.
Similarly, recovery time may be slower if airflow cannot remove particles from dead zones.
This is why cleanroom HVAC design should evaluate:
- Airflow volume
- Airflow direction
- Pressure cascade
- Filtration efficiency
- Recovery performance
- Real airflow behavior
Together, these factors provide a more complete picture of contamination control.
Buyer and EPC Checklist
When requesting cleanroom airflow visualization, include these items in the RFQ or qualification plan:
- Cleanroom classification
- Room layout drawing
- HVAC airflow design
- HEPA filter locations
- Return air grille locations
- Pressure cascade design
- Equipment layout
- Personnel flow
- Material flow
- Door and pass box locations
- Test condition: at-rest or operational
- Video recording requirement
- Acceptance criteria
- Applicable standards or GMP requirements
This helps avoid vague testing and makes the result more useful for engineering review.
Best Practices
- Plan airflow visualization before commissioning.
- Test critical areas first.
- Include doors, pass boxes, and equipment obstruction points.
- Record videos for review and documentation.
- Perform testing under realistic operating conditions where required.
- Review airflow together with particle count, pressure, ACH, and recovery results.
- Correct airflow problems before final handover.
- Avoid relying only on calculated airflow.
Conclusion
Cleanroom airflow visualization is one of the most practical methods for understanding how a cleanroom actually performs after installation.
While ACH, HEPA filtration, differential pressure, and particle testing are essential, they do not fully reveal airflow behavior. A smoke study can show whether clean air protects critical areas, whether contaminants may migrate, and whether the room layout supports reliable contamination control.
For professional cleanroom projects, airflow visualization should be treated as an engineering verification tool—not just a compliance video. When properly planned and interpreted, it helps reduce contamination risk, improve HVAC performance, and support long-term cleanroom reliability.
FAQ
What is cleanroom airflow visualization?
Cleanroom airflow visualization is a test method that uses visible smoke or fog to show airflow direction, turbulence, dead zones, and contamination control behavior inside a cleanroom.
Is airflow visualization the same as a smoke study?
Yes. In many cleanroom projects, airflow visualization is commonly called a smoke study.
Why is airflow visualization important?
It helps verify whether clean air moves as intended and whether critical areas are protected from contamination risks.
Does high ACH mean airflow is good?
Not necessarily. A room may have high ACH but still have turbulence, dead zones, or poor airflow distribution.
When should a smoke study be performed?
It may be performed during commissioning, qualification, troubleshooting, layout changes, or contamination investigations.
Is airflow visualization required for every cleanroom?
Not always. It depends on cleanroom application, process risk, regulatory expectations, and project qualification requirements.
What problems can airflow visualization identify?
It can identify turbulence, reverse flow, stagnant zones, short-circuiting, poor return air design, and airflow disturbance caused by equipment or personnel.